Understanding the Power of Google Analytics for Website Traffic Tracking
In today's digital landscape, understanding your website traffic is paramount to online success. Without a clear picture of who is visiting your site, where they're coming from, and what they're doing, you're essentially flying blind. That's where Google Analytics comes in. This powerful, free tool provides invaluable insights into your website's performance, allowing you to make data-driven decisions to improve user experience, boost conversions, and enhance your overall online presence. This guide will walk you through the essential steps of using Google Analytics to effectively track your website traffic.
Setting Up Google Analytics: A Step-by-Step Guide
Before you can start analyzing your website traffic, you need to set up Google Analytics. Here's how:
1. Create a Google Analytics Account
If you don't already have one, you'll need a Google account. Once you have that, head over to the Google Analytics website (analytics.google.com) and sign in. Click on the "Start measuring" button to begin the setup process.
2. Set Up Your Property
Next, you'll need to set up a property for your website. A property represents your website in Google Analytics. You'll be prompted to enter your website's name, URL, industry category, and reporting time zone. Make sure to choose the category that best reflects your website's content, as this will help Google Analytics provide more relevant insights.
3. Install the Google Analytics Tracking Code
This is the most crucial step. Google Analytics will generate a unique tracking code (a JavaScript snippet) that you need to install on every page of your website. This code allows Google Analytics to collect data about your visitors. There are several ways to install the tracking code:
- Directly into your website's HTML: Copy the tracking code and paste it into the <head> section of your website's HTML code, before the closing </head> tag. This is the most traditional method.
- Using a plugin (for WordPress, etc.): Many popular content management systems (CMS) like WordPress offer plugins that simplify the process of adding the tracking code. Search for a Google Analytics plugin, install it, and follow the plugin's instructions to connect it to your Google Analytics account. This is often the easiest method for non-developers.
- Using Google Tag Manager: Google Tag Manager is a tag management system that allows you to manage and deploy various tracking codes (including Google Analytics) without directly editing your website's code. This is a more advanced option but offers greater flexibility and control.
Once the tracking code is installed, give Google Analytics some time to start collecting data. It usually takes a few hours for data to appear in your reports.
Understanding the Google Analytics Interface
Now that you have Google Analytics set up, let's explore the interface and the key reports you'll be using to track your website traffic.
The Main Navigation
The left-hand navigation menu is your gateway to all the reports and features in Google Analytics. Here's a breakdown of the main sections:
- Realtime: See what's happening on your website right now. This report shows you the number of active users, the pages they're visiting, their locations, and traffic sources.
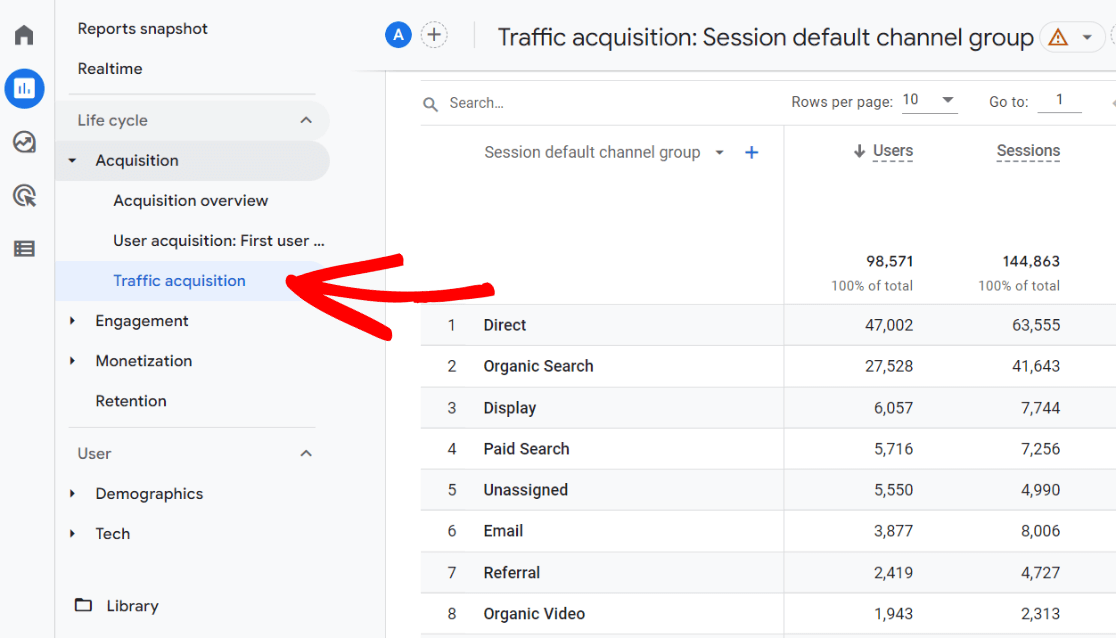
- Acquisition: Understand where your traffic is coming from. This section provides insights into your traffic sources, such as organic search, paid advertising, social media, and referral websites.
- Engagement: Analyze how users interact with your website. This section includes reports on page views, bounce rate, session duration, and events.
- Monetization: If you're running an e-commerce website, this section provides data on revenue, transactions, and product performance.
- Demographics: Understand who your visitors are. This section provides data on age, gender, interests, and location. Note that these reports often require enabling demographic data collection within Google Analytics.
Key Reports for Tracking Website Traffic
Within the Google Analytics interface, several reports are particularly useful for tracking and analyzing your website traffic.
1. Acquisition Overview Report
This report provides a high-level overview of your traffic sources. It shows you the percentage of traffic coming from each channel, such as Organic Search, Direct, Referral, Social, and Paid Search. This report is a great starting point for understanding where your traffic is coming from and identifying areas for improvement.
2. Source/Medium Report
The Source/Medium report provides more granular detail about your traffic sources. It shows you the specific websites or platforms that are sending traffic to your website. For example, you might see traffic from google/organic (organic search from Google), facebook.com/referral (referral traffic from Facebook), or example.com/referral (referral traffic from another website). This report helps you identify your most valuable traffic sources and optimize your marketing efforts accordingly.
3. Landing Pages Report
The Landing Pages report shows you the pages on your website that users are landing on. This report is useful for understanding which pages are attracting the most traffic and for optimizing those pages for conversions. You can also see metrics like bounce rate and session duration for each landing page, which can help you identify pages that need improvement.
4. All Pages Report
This report shows you the most popular pages on your website. It tracks metrics like page views, unique page views, average time on page, and bounce rate for each page. This report helps you understand which content is resonating with your audience and identify areas where you can improve user engagement.
5. Behavior Flow Report
The Behavior Flow report visualizes the paths that users take through your website. It shows you the pages that users visit after landing on a particular page, allowing you to understand how users are navigating your site and identify potential bottlenecks or areas where users are dropping off. This report is invaluable for optimizing your website's navigation and user experience.
Using Segments to Analyze Specific Traffic
Segments allow you to isolate and analyze specific subsets of your website traffic. For example, you can create a segment to analyze traffic from mobile users, traffic from a specific country, or traffic that converted on a particular goal. Segments are a powerful way to gain deeper insights into your website traffic and identify opportunities for improvement.
Creating and Applying Segments
To create a segment, click on the "Add Segment" button at the top of any report in Google Analytics. You can choose from a variety of pre-defined segments, such as "Mobile Traffic" or "Organic Traffic," or you can create your own custom segments based on demographics, behavior, technology, or traffic sources. Once you've created a segment, you can apply it to any report in Google Analytics to filter the data and focus on the specific traffic you're interested in.
Setting Up Goals and Conversions
Tracking goals and conversions is essential for understanding how your website traffic is translating into business results. A goal represents a specific action that you want users to take on your website, such as filling out a contact form, subscribing to a newsletter, or making a purchase. By setting up goals in Google Analytics, you can track how many users are completing these actions and identify areas where you can improve your conversion rates.
Defining Goals
To set up a goal, go to the "Admin" section of Google Analytics and click on "Goals" under the "View" column. You can choose from a variety of goal templates, such as "Destination" (when a user reaches a specific page), "Duration" (when a user spends a certain amount of time on your website), "Pages/Screens per session" (when a user views a certain number of pages), or "Event" (when a user triggers a specific event, such as clicking a button). Once you've chosen a goal type, you'll need to provide more details about the goal, such as the destination URL or the event category and action.
Leveraging Data for Website Optimization
The ultimate goal of tracking website traffic with Google Analytics is to use the data to optimize your website and improve your online performance. Here are some ways you can leverage your Google Analytics data to make informed decisions:
- Identify your top-performing content: Focus on creating more content that resonates with your audience.
- Improve underperforming pages: Analyze the bounce rate and time on page for underperforming pages and make changes to improve user engagement.
- Optimize your website for mobile devices: If a significant portion of your traffic is coming from mobile devices, ensure that your website is mobile-friendly.
- Improve your website's navigation: Use the Behavior Flow report to identify areas where users are dropping off and improve your website's navigation.
- Target your marketing efforts: Focus your marketing efforts on the traffic sources that are driving the most conversions.
By consistently monitoring your website traffic and using the insights from Google Analytics to make improvements, you can significantly enhance your website's performance and achieve your online goals.